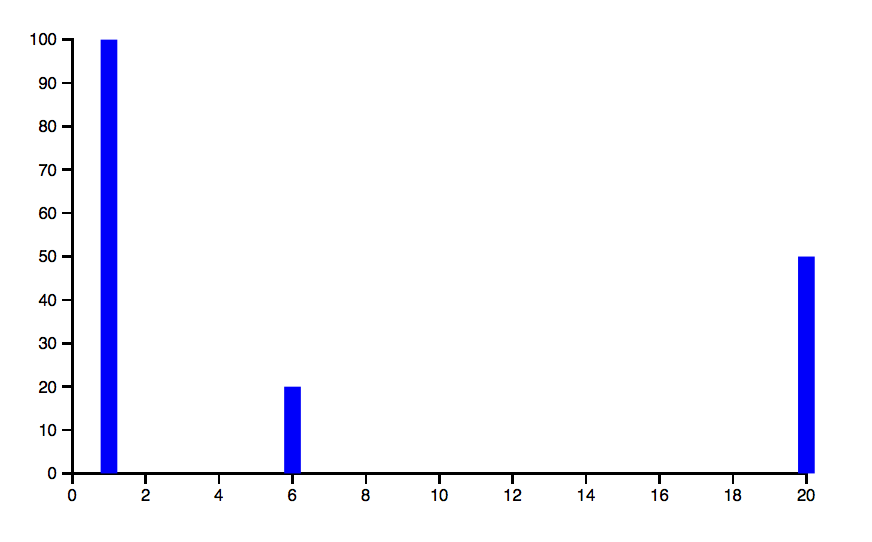
SVG D3.js bar chart
This has been driving me up the wall. I haven't felt so stupid in a long time. Anyway, since I managed it finally, here is some code:
<html>

<head>

<script type="text/javascript" src="d3/d3.v3.min.js"></script>
<style type="text/css">
.axis text {
font: 10px sans-serif;
}
.axis path, .axis line {
fill: none;
stroke: #000;
shape-rendering: crispEdges;
}
</style>
</head>
<body>
<div id="chart"></div>
</body>
<script type="text/javascript">
var margin = {top: 10, right: 10, bottom: 30, left: 50},
width = 500 - margin.left - margin.right,
height = 300 - margin.top - margin.bottom;
var x = d3.scale.linear()
.domain([0, 20])
.range([0, width]);
var y = d3.scale.linear()
.domain([0,100])
.range([height,0]);
var xAxis = d3.svg.axis()
.scale(x)
.orient("bottom");
var yAxis = d3.svg.axis()
.scale(y)
.orient("left");
var svg = d3.select("#chart").append("svg")
.attr("width", width + margin.left + margin.right)
.attr("height", height + margin.top + margin.bottom)
.append("g")
.attr("transform", "translate(" + margin.left + "," + margin.top + ")");
svg.append("g")
.attr("class", "x axis")
.attr("transform", "translate(0," + height + ")")
.call(xAxis);
svg.append("g")
.attr("class", "y axis")
.call(yAxis);
var data = [[1,100],[6,20],[20, 50]];
var bars = svg.selectAll("rect")
.data(data)
.enter().append("rect")
.attr("x", function(d) {return x(d[0]) - 5;})
.attr("y", function(d) {return y(d[1]);})
.attr("width",10)
.attr("height", function(d) {return height - y(d[1]);})
.style("fill","blue");
</script>
</html>
and the output:
Adapted from this example on jsfiddle. Another good source of information is Scott Murray's d3.js tutorials particularly scales and axes.
